Life insurance is a promise: you pay premiums today so that, decades from now, your family is paid when they need it most. The single most important question about any insurer is therefore simple – when a claim is made, does the money come out? This page ranks all 14 of Nepal’s life insurers on that question, using the Nepal Insurance Authority’s own FY 2081/82 figures – and, just as important, it explains honestly what the number can and cannot tell you.
How we measure this – and what it does not mean
We want to be straight with you about the number before you read the table, because most sites are not. The Nepal Insurance Authority (NIA) does not publish a per-company “claim settlement ratio.” Its annual report publishes two separate figures for each insurer: the total amount of claims paid, and the total amount of claims still outstanding at year-end (Schedules 14 and 15). The percentage you see here is one we derive from those two amounts:
Claim settlement ratio = claims paid / (claims paid + claims outstanding) x 100
Three things follow from how it is built, and they matter for every company on the list:
- It is amount-based, not a headcount. A 90% ratio does not mean “90 of every 100 claims are paid.” It means 90% of the rupee value of claims has been settled. One large claim still under process can move the number more than many small ones.
- It is a year-end snapshot. Claims that are simply still being verified sit in the “outstanding” column on the cut-off date and pull the ratio down – even though they will be paid. Insurers with a large or fast-growing book of policies naturally carry a bigger outstanding queue.
- It excludes rejected claims. The NIA does not publish per-company rejection or repudiation figures, so this ratio cannot capture them at all.
The honest takeaway: a high ratio is a genuinely good sign of operational reliability, and a low one is worth questioning – but a low number is not proof that a company denies claims. Read it together with the year-on-year trend, the company’s size, and its service reputation. We show all of those below.
All 14 life insurers ranked (FY 2081/82)
| # | Company | Claim ratio FY 2081/82 | vs FY 2080/81 | Claims paid (Rs. crore) |
|---|---|---|---|---|
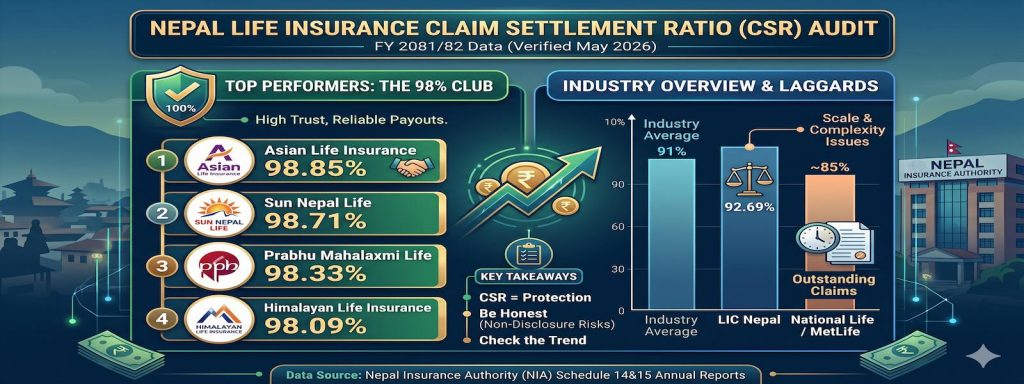
| 1 | Asian Life | 98.85% | up (98.49%) | 618.89 |
| 2 | Sun Nepal Life | 98.71% | up (98.60%) | 157.34 |
| 3 | Prabhu Mahalaxmi Life | 98.33% | down (98.56%) | 115.08 |
| 4 | Himalayan Life | 98.09% | up (97.94%) | 733.85 |
| 5 | Reliable Nepal Life | 97.92% | up (96.47%) | 143.91 |
| 6 | SuryaJyoti Life | 97.50% | down (98.73%) | 369.67 |
| 7 | Citizen Life | 93.87% | up (92.84%) | 191.18 |
| 8 | LIC Nepal | 92.69% | down (96.40%) | 1,259.02 |
| 9 | Nepal Life | 90.54% | up (90.04%) | 1,919.65 |
| 10 | Rastriya Jeevan Beema | 89.94% | up (88.53%) | 656.19 |
| 11 | MetLife Nepal | 85.23% | down (85.67%) | 294.62 |
| 12 | National Life | 84.55% | down (93.40%) | 1,107.13 |
| 13 | Sanima Reliance Life | 80.97% | down (81.60%) | 177.12 |
| 14 | IME Life | 79.90% | up (79.38%) | 128.37 |
Derived by us from NIA Annual Report FY 2081/82, Schedules 14 (claims paid) and 15 (claims outstanding). “vs FY 2080/81” shows the direction of the same derived ratio against the prior year.
Not sure which plan fits you? Answer 5 questions and get a personalised match.
Find My Plan →Reading the table fairly
The top tier (97%+)
Asian Life, Sun Nepal, Prabhu Mahalaxmi, Himalayan, Reliable, and SuryaJyoti all settled more than 97% of claim value with very small outstanding balances. Asian Life leads at 98.85% on barely Rs. 7 crore outstanding against Rs. 619 crore paid – a genuinely strong operational record. Reliable’s jump from 96.47% to 97.92% is the clearest year-on-year improvement in the group.
The large-book insurers
Nepal Life (90.54%) and National Life (84.55%) sit lower on the table, and here the structure of the metric genuinely matters – this is context you can verify in the numbers, not an excuse. Nepal Life is the country’s largest insurer and pays the most of anyone in rupee terms (Rs. 1,919.65 crore in FY 2081/82); its ratio is actually improving. National Life’s ratio fell sharply because its outstanding balance jumped from about Rs. 59 crore to Rs. 202 crore in a single year while its payouts grew fast (Rs. 833 to Rs. 1,107 crore) – a swelling pipeline, not evidence of refusal. LIC Nepal’s dip (96.40% to 92.69%) has the same signature: outstanding more than doubled to Rs. 99 crore on a large book.
Lower on the measure
MetLife (85.23%), Sanima Reliance (80.97%), and IME Life (79.90%) are the lowest on our amount-based ratio this year. We will not invent flattering reasons for them. Because the ratio is amount-based and counts the year-end outstanding balance, smaller insurers move more on a handful of large unsettled claims, and remember the number says nothing about rejected claims. So a low score here is not proof that claims are denied – but it is a fair reason to ask these insurers directly about typical settlement timelines before you buy. IME, the lowest, still paid Rs. 128 crore in claims during the year; its position reflects a relatively high outstanding balance against a smaller book.
What the ratio cannot tell you – why claims face friction
Most claim delays in Nepal are not about a company being unwilling to pay. The recurring, well-documented friction points are at the application and documentation stage – and the good news is that they are largely in your control:
- Non-disclosure at purchase. Leaving out a pre-existing condition, even a minor one, gives an insurer legal grounds to contest a claim later. Honest disclosure when you buy is the single biggest thing you can do to protect your family.
- Early-claim scrutiny. Claims made in the first few years of a policy are investigated more closely as a standard fraud-prevention step across the industry.
- Document mismatches. Delays often happen because the death certificate, nominee, and legal-heir records do not match the policy exactly. Keeping nominee details current avoids most of this.
How to use this when choosing a policy
- Look at the trend, not one year. A company holding or improving its ratio over time (Asian, Sun Nepal, Reliable) tells you more than a single snapshot.
- Treat the ratio as your safety filter first, bonus second. A strong bonus rate means little if settlement is slow when your family needs it. Compare insurers on claims first, then on overall strength and bonus.
- Disclose your health honestly. A correctly underwritten policy that pays is worth far more than a cheaper one that can be contested.
Insurance is the one product you buy hoping your family never has to use it. But if they do, these are the numbers that will matter – which is exactly why we have shown you how they are built, not just where each company lands.
Data source: NIA Annual Report FY 2081/82, Schedules 14 (claims paid) and 15 (claims outstanding). The claim settlement ratio is our own amount-based derivation – the NIA does not publish a per-company ratio. Figures are in NPR crore. Full disclaimer.